
Most businesses already have more data than they know what to do with.
Sales data sits in a CRM. Financial information lives in an accounting system, while operational data may come from an ERP, internal applications or spreadsheets. Customer information is often stored somewhere else. Each system may work perfectly well on its own, but bringing all that information together to answer a simple business question can still take hours.
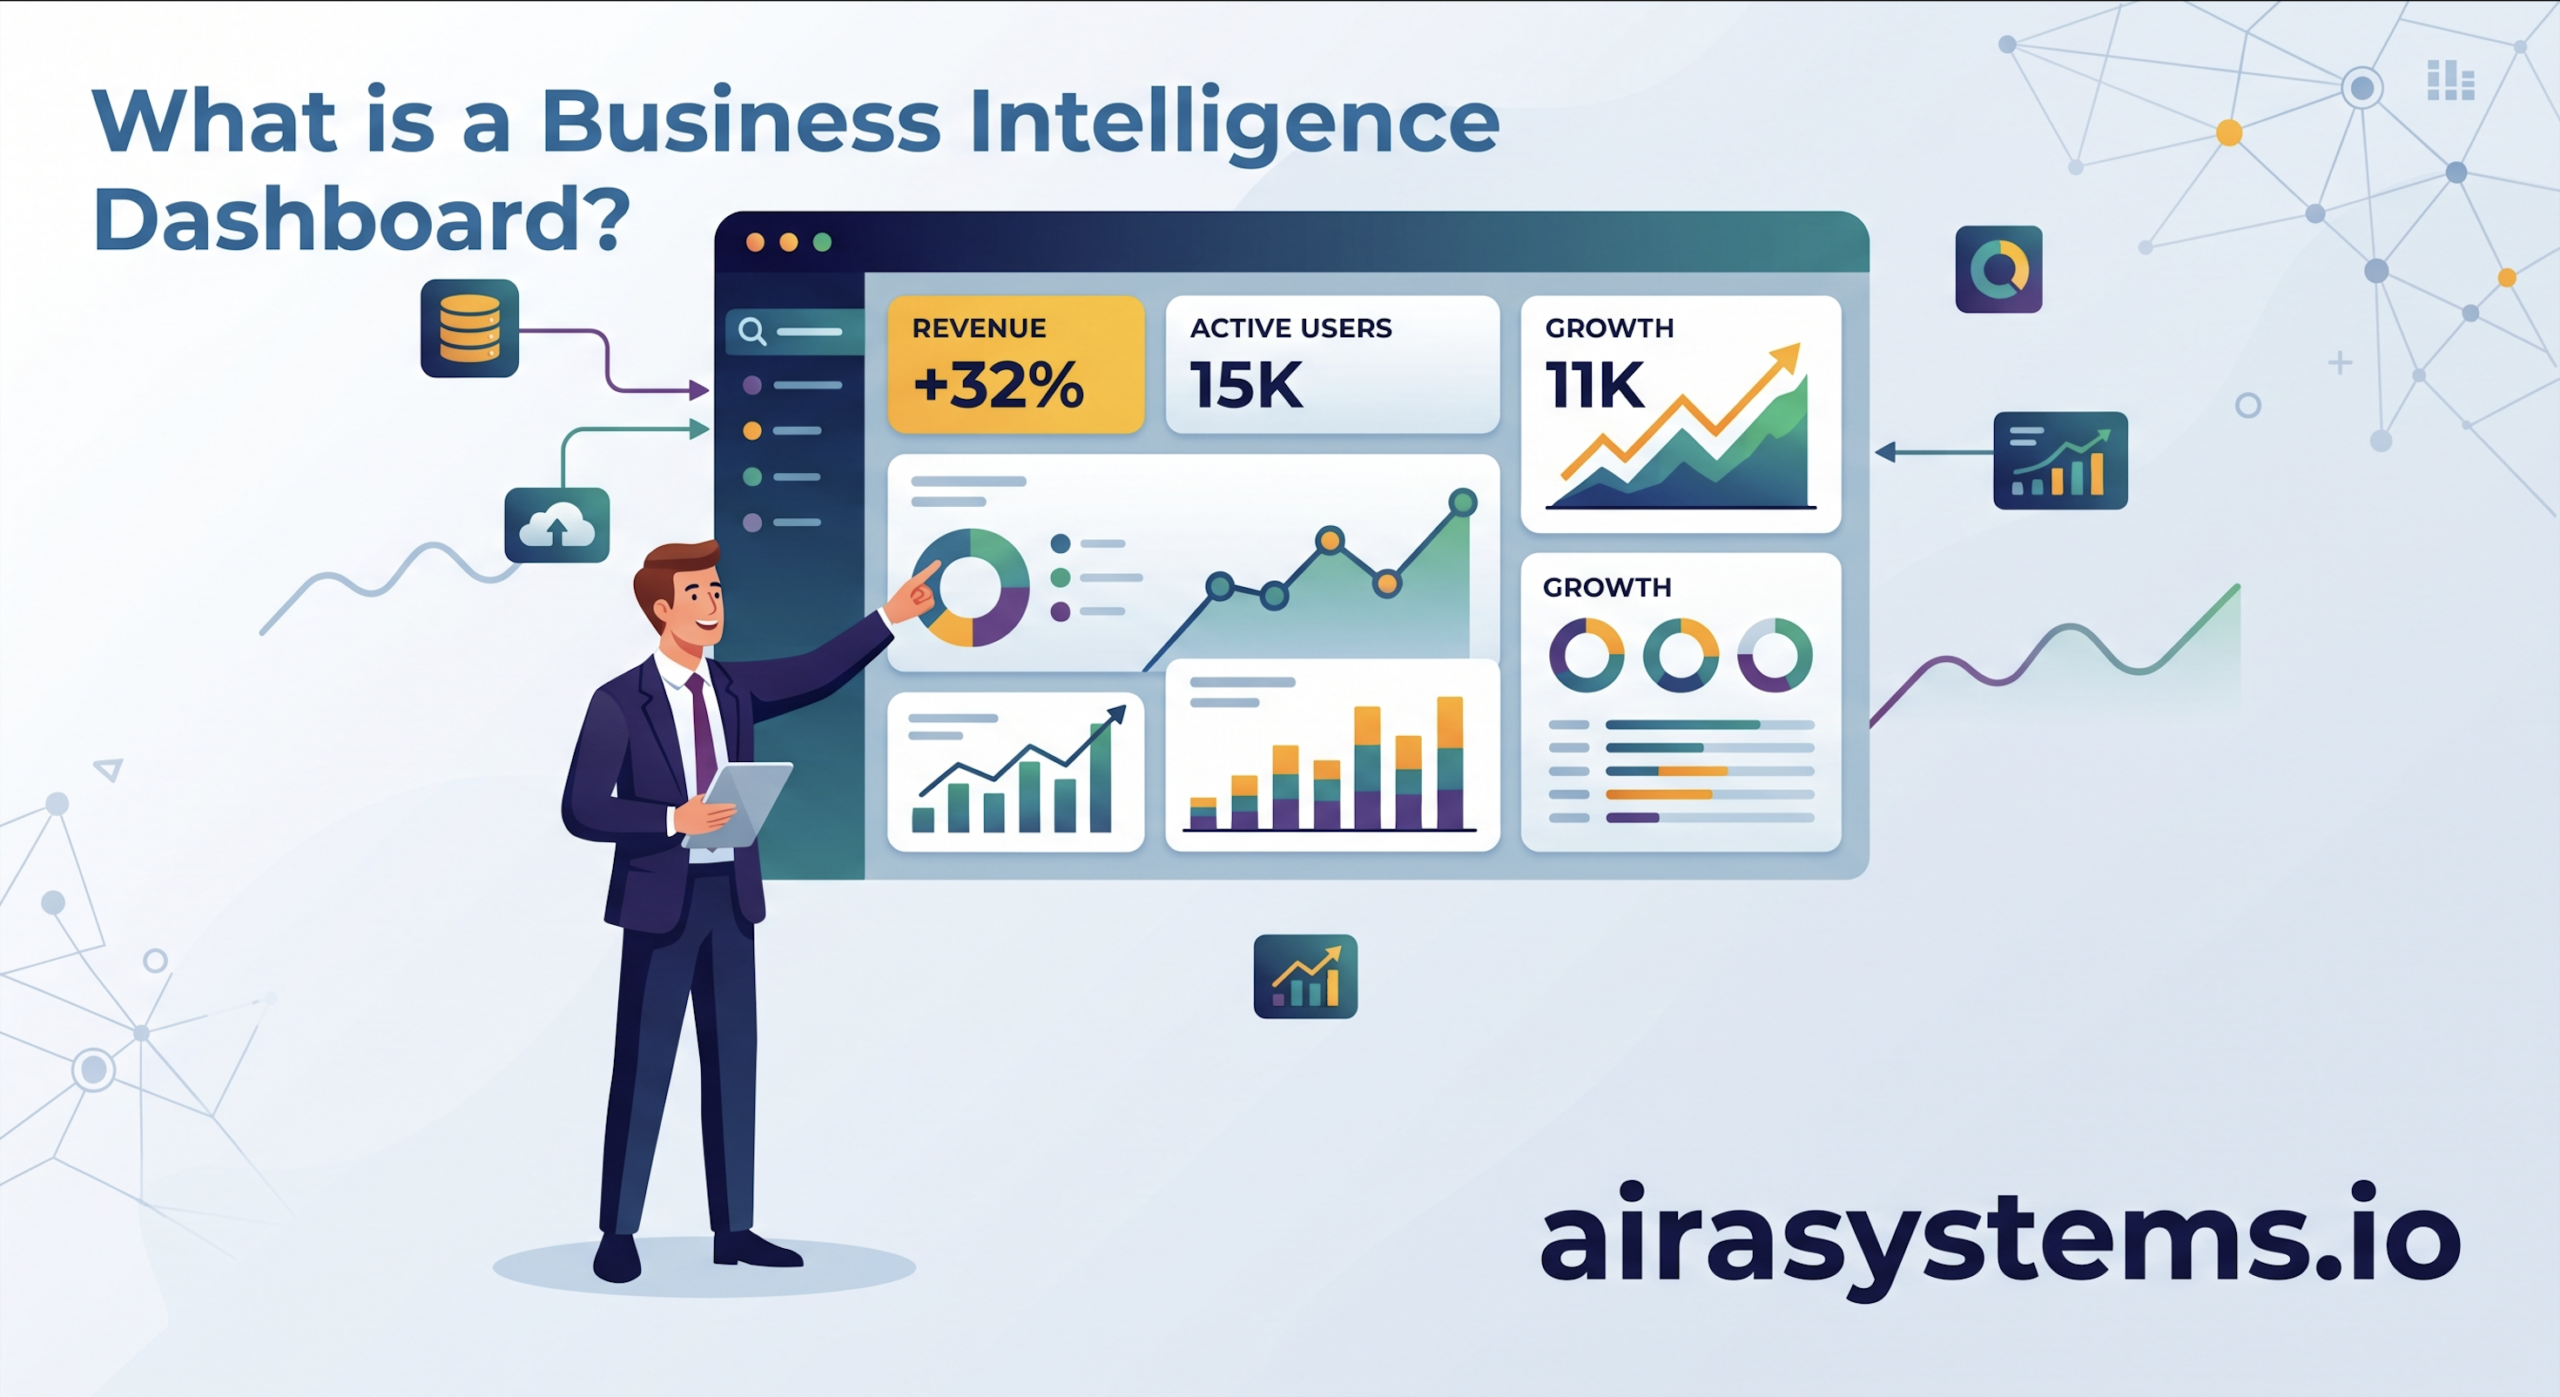
This is where business intelligence dashboards become valuable. They bring data from different sources into a single, interactive view, helping businesses monitor KPIs, identify trends and turn complex information into actionable insights.
But a dashboard is not useful simply because it contains charts.
The real question is: Can your dashboard help the right person make a better decision at the right time? That is the standard that should guide any BI project.
What Is Business Intelligence?
Business Intelligence is a combination of technologies, processes and practices used to turn business data into information that people can use for decision-making. It is useful to distinguish BI from data analytics.
Data analytics focuses on examining data to find patterns, trends, relationships and predictions. Business Intelligence takes those insights and makes them accessible to the people who need to act on them — often through dashboards, reports, visualizations and other tools.
For example, analytics might reveal that customer churn increased by 12% among a particular customer segment. A BI dashboard can put that information in front of the sales or customer success team alongside the other metrics they need to decide what to do next. In other words:
Analytics finds the insight.
Business Intelligence makes the insight usable.
What Is a Business Intelligence Dashboard?
A business intelligence dashboard is an interactive tool that presents important business metrics and KPIs in a single view. Modern dashboards can bring together data from multiple sources and provide a consolidated view of business performance. Microsoft Learn — Introduction to dashboards for Power BI designers
A modern BI dashboard can combine:
- Key Performance Indicators (KPIs)
- Charts and graphs
- Tables
- Trends and Comparisons
- Filters
- Drill-downs
- Historical data
- Real-time or regularly refreshed data
- Alerts and notifications
Unlike a static report, an interactive dashboard allows users to explore the information themselves. They can filter results by date, region, product or customer segment and drill down from a high-level KPI into the underlying data.
For example, a sales director might see:
€2.4M Revenue
and then explore:
- Which products generated the revenue?
- Which regions performed best?
- How does this compare with last quarter?
- Which customers contributed the most?
- Where are sales declining?
The dashboard is therefore not simply displaying information. It is providing a way to explore information and move toward a decision.
Data Sources
CRM · ERP · Finance · Operations · Internal Systems
Business Intelligence
Integration · Processing · Analysis
BI Dashboard
KPIs · Trends · Filters · Drill-down
Business Decision
Understand · Detect · Decide · Act
What Does a Modern Business Intelligence Dashboard Actually Do?
A useful BI dashboard performs several functions at the same time.
Connect
A dashboard can bring information together from multiple data sources, including databases, CRM and ERP systems, data warehouses, internal applications and external feeds.
Visualize
Charts, tables and KPI cards make large amounts of information easier to understand. Good visualization is not about making a dashboard look impressive. It is about making important information understandable quickly.
Filter
Users can narrow the information they are viewing by parameters such as date, department, region, product or customer segment.
Drill Down
A high-level KPI can lead to more detailed information.
For example:
Revenue ↓
- → Region
- → Product
- → Customer
- → Individual transaction
This allows users to move from a business outcome to the information that explains it.
Monitor
Dashboards can provide an ongoing view of operational or strategic performance. Depending on the underlying systems, data can be updated in real time or according to a defined refresh schedule.
Detect
Dashboards can make unusual patterns, declining KPIs or other exceptions easier to identify.
Act
Ultimately, all of these capabilities serve one purpose: helping people make better decisions.
Types of Business Intelligence Dashboards
Not every dashboard should look or behave the same way. The right dashboard depends on who uses it and what decisions they need to make.
Operational Dashboards
Operational dashboards answer:
What is happening right now?
They are designed for day-to-day monitoring of areas such as sales, orders, inventory, customer support or production.
Analytical Dashboards
Analytical dashboards answer:
Why is this happening?
They are designed for exploring trends, relationships and historical performance. Users may compare periods, segments, products or regions and drill into the data to understand what is driving a particular result.
Strategic Dashboards
Strategic dashboards answer:
Where is the business going?
They focus on a smaller number of high-level KPIs, such as revenue growth, profitability, customer retention and strategic targets.
An operational dashboard used by a daily support team should not necessarily look like an executive dashboard used for quarterly planning.
Why Do Businesses Invest in BI Dashboards?
The business case for BI should not simply be: “We have a lot of data.”
It should be: We need to make important decisions faster, more accurately or with less manual effort.
Well-designed dashboards can help businesses:
- Reduce manual reporting
- Improve visibility into business performance
- Identify problems earlier
- Reduce errors caused by manual data handling
- Track KPIs consistently
- Improve operational efficiency
- Make decisions using current information
The important distinction is that the ROI does not come from the dashboard itself.
It comes from the business outcomes the dashboard improves.
What Is the ROI of a Business Intelligence Dashboard?
ROI is one of the most important questions to ask before investing in BI. The calculation should include the full cost of BI, not just the software license. Costs can include:
- BI platform licenses
- Data integration
- Data preparation
- Dashboard development
- Infrastructure
- Maintenance
- Training
- Internal team time
The return can come from both direct and indirect benefits.
Direct ROI
These are relatively easy to measure:
- Reduced reporting costs
- Hours saved on manual reporting
- Reduced operational costs
- Increased sales conversion
- Improved resource utilization
- Fewer data-related errors
Indirect ROI
Other benefits can be harder to assign a direct monetary value to:
- Faster decision-making
- Better management visibility
- Improved collaboration
- Higher employee productivity
- Better customer experience
- Greater confidence in business data
For example, if a team previously spent 40 hours every month preparing management reports and a BI solution reduces that to five hours, the time savings can be measured directly. But if the same dashboard allows management to identify a declining product category two months earlier, the resulting business value may be considerably larger. That is why BI ROI should be evaluated based on business outcomes rather than the number of dashboards created.
Are Dashboards Outdated?
No. But the traditional dashboard is changing.
The idea of putting business metrics on a screen is not new. Dashboards have existed in various forms for decades, evolving from relatively static executive information systems into interactive BI tools and self-service analytics platforms.
What has changed is what users expect from them. A traditional dashboard might answer:
What happened?
A modern BI environment should increasingly help answer:
What is happening?
Why is it happening?
What should we do next?
Modern dashboards can combine interactive exploration, real-time or frequently refreshed data, alerts, drill-down capabilities and AI-assisted analysis. AI can also help with tasks such as dashboard creation, data preparation, visualization recommendations and identifying trends. So dashboards are not becoming obsolete.
Static, disconnected dashboards are.
The dashboard is becoming one part of a broader decision-support system.
Traditional vs Modern BI
Traditional Dashboard
- Static reporting
- Periodic updates
- Manual analysis
Modern BI Dashboard
- Connected data
- Interactive analysis
- Automated insights
Can ChatGPT Create a Dashboard?
Yes.
ChatGPT and other AI tools can help create parts of a dashboard. For example, AI can assist with:
- Analyzing CSV or Excel data
- Identifying potential KPIs
- Writing SQL queries
- Generating JavaScript or React code
- Creating charts and visualizations
- Suggesting dashboard layouts
- Exploring datasets
- Finding patterns or anomalies
- Creating a working dashboard prototype
AI is also increasingly being incorporated directly into BI platforms to automate parts of dashboard creation, data preparation and analysis. So why not simply ask ChatGPT to build the entire BI system? Because a production BI solution is much more than its interface.
A dashboard is only the visible layer
A reliable BI system also needs:
Data integration
Where does the information come from?
Data quality
Can the numbers be trusted?
Business logic
How are KPIs calculated?
Security
Who can access which information?
Data refresh
How and when is information updated?
Maintenance
What happens when a source system changes?
ChatGPT can help with many individual tasks.
It does not automatically understand your organization’s entire data architecture, business rules, security model or operational requirements.
AI can build the interface. But…
AI can help build
- Prototype
- UI
- Queries
- Charts
- Analysis
Production BI requires
- Reliable data
- Integration
- Business logic
- Security
- Permissions
- Maintenance
Prototype ≠ Production BI System
AI is a powerful development tool, but it does not replace the architecture and engineering required for a reliable production BI solution.
When Should You Build a Custom BI Dashboard?
Standard BI platforms can be an excellent choice for many organizations. A custom solution becomes more valuable when the business requirements go beyond standard reporting. A custom BI dashboard may make sense when:
- Data comes from multiple business systems
- Teams rely heavily on Excel and manual reporting
- Existing dashboards cannot reflect specific business logic
- Different departments need different views of the same data
- Custom integrations are required
- Role-based access is important
- The dashboard needs to be embedded into an existing application
- The organization has unique operational workflows
- Standard BI tools cannot provide the required user experience
The decision should start with the business question, not the technology.
Instead of asking:
“Which dashboard tool should we buy?”
Start with:
“Which decisions do we need to make faster or better?”
Then work backwards to the KPIs, data and technology required to support those decisions.
A Real-World Example: Turning Complex Business Data Into Operational Visibility
One example from our own work is a custom CRM platform developed for VSOA, a Belgian police union.
The platform supports more than 20,000 active members, with more than 1,000 administrators using the system daily. It includes approximately 40 roles across 11 regions and integrates with external services and systems including SEPA, IBAN validation, XML exports, 3CX and Orbis.
The challenge was not simply storing information. At this scale, administrators need access to information relevant to their responsibilities and a clear view of what is happening across the organization. The platform brings operational information into a centralized environment with role-based access and views designed around the organization’s structure.
This illustrates an important BI principle:
The value is not in displaying as many metrics as possible. It is in making complex operational data useful.
The same principle applies whether analytics is delivered through a standalone BI platform or built directly into an internal business application.
This approach eliminates the need to switch between systems and can make analytics part of the user’s normal workflow. The important point is that the technology should follow the business requirement — not the other way around.
Common Business Intelligence Dashboard Mistakes
A dashboard can contain accurate data and still fail. The most common problems are often not technical.
BI dashboard pitfalls
- Tracking too many KPIs
- Building dashboards without defining business questions first
- Ignoring data quality
- Connecting systems without understanding the underlying data
- Creating dashboards users do not actually need
- Showing numbers without context
- Making dashboards unnecessarily complex
- Treating visualization as a substitute for analysis
Good dashboard design starts with the decisions users need to make — not with a collection of charts.
What Makes a BI Dashboard Actually Useful?
A useful dashboard should answer three fundamental questions.
What is happening?
The current state of the business.
KPIs · Performance · Trends
Why is it happening?
The context behind the numbers.
Filters · Comparisons · Drill-down · Historical data
What should we do?
The action that follows from the information.
Alerts · Priorities · Decisions · Actions
This creates a simple but powerful chain:
Conclusion
Business Intelligence dashboards are not about putting more charts on a screen. They are about connecting the right data with the right people and making that information useful at the moment a decision needs to be made. A well-designed dashboard can reduce manual reporting, improve visibility, identify problems earlier and give teams a clearer understanding of business performance.
But successful BI requires more than visualization. It requires reliable data, thoughtful integration, clear business logic, appropriate security and a deep understanding of how people actually use information.
AI tools such as ChatGPT can accelerate parts of the process, from prototyping interfaces to analyzing data and generating code. But a production BI solution still needs a solid technical and business foundation. The best BI implementation starts with a simple question:
Which decisions could your business make faster or better if the right information were available immediately? That is where a useful dashboard begins.
Need a Business Intelligence dashboard built around your business?
AiraSystems designs and develops custom Business Intelligence & Dashboards solutions that connect business data, visualize the metrics that matter and turn complex information into actionable insights.